

Looking for a suitable motor?


小编
Published2025-10-15
Unleashing Precision and Power: Exploring the Power Gear Slide Motor Chart
In the realm of mechanical engineering and automation, the sliding motor stands out as a marvel of innovation—bringing together power, precision, and versatility. These motors, essential in industries ranging from manufacturing to robotics, operate with a delicate balance of torque and speed, meticulously calibrated through gear mechanisms. At the heart of understanding and optimizing their performance lies the often-underestimated yet critically important “Power Gear Slide Motor Chart.” This chart is more than just a collection of numbers; it is a roadmap for engineers and technicians, guiding the design, maintenance, and troubleshooting of these sophisticated machines.
What is a Power Gear Slide Motor?
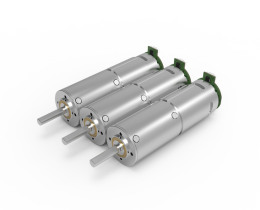
Before delving into the chart itself, it’s important to unpack what a power gear slide motor actually does. Essentially, it is a motor integrated with a gear assembly that translates high-speed, low-torque input into low-speed, high-torque output—perfect for applications requiring significant force in a controlled manner. The sliding aspect refers to the linear motion that is often achieved through precise gear engagement, allowing machines to perform tasks like lifting, pressing, or linear positioning.
Understanding the Gear Chart
The “Power Gear Slide Motor Chart” functions as a detailed guide that maps out the relationship between various gear ratios, torque outputs, and rotational speeds. It is a vital tool for selecting the right gear configuration for specific applications, ensuring optimal performance and longevity.
Imagine the gear chart as a multi-layered map, where each layer offers insights into different performance metrics. These include gear ratio, gear efficiency, torque multiplication, and RPM (revolutions per minute). By consulting the chart, engineers can swiftly identify the most appropriate gear setup for a given task, whether it’s lifting heavy loads, precision positioning, or achieving high speeds.
Key Components of the Chart
Gear Ratios: Central to the chart are the gear ratios, which denote the relationship between the driver gear (connected to the motor) and the driven gear (connected to the load). A ratio of 10:1 means the driven gear turns once for every ten turns of the driver gear, multiplying torque at the expense of speed.
Torque and Power: The chart provides data on the torque output corresponding to each gear ratio, highlighting how increased gear ratios boost torque but reduce rotational speed.
Efficiency Metrics: Not all gears operate at perfect efficiency; some energy is lost due to friction and other factors. The chart indicates efficiency percentages, aiding in selecting gear configurations that balance performance with minimal energy waste.
Speed (RPM): Understanding how different gear ratios impact rotational speeds allows engineers to tailor systems for specific functions—such as slow, powerful lifts or rapid movements.
Applying the Chart in Real-World Scenarios
Suppose a manufacturing line requires a sliding motor to operate a heavy-duty press. The design team would consult the gear chart to choose a gear ratio that delivers maximum torque while maintaining manageable speed—protecting the machinery and ensuring safety. Conversely, in robotics, a focus might be on achieving quick, precise movements, leading designers to select configurations with lower gear ratios for higher speeds.
The Importance of Customization and Fine-Tuning
While the chart offers standardized data, real-world applications often demand customization. Engineers might fine-tune gear configurations based on factors like load dynamics, operational environment, and maintenance constraints. The gear chart, combined with empirical testing, becomes a powerful tool to optimize system performance, reduce wear and tear, and extend service life.
Maintenance and Troubleshooting
A clear understanding of the gear relationships also simplifies maintenance. If a system isn’t performing as expected—say, sluggish movement or excessive heat—consulting the gear chart might reveal mismatched gear ratios or inefficiency sources. Regularly referencing the chart during maintenance ensures that gear wear and system drift are kept in check, avoiding costly downtimes.
Future Trends and Innovations
The evolution of gear design and lubrication technologies continues to enhance the capabilities illustrated by gear charts. Modern materials reduce friction, and computer-aided design (CAD) allows for micro-adjustments in gear profiles, leading to increased efficiency and durability. The gear chart will evolve alongside these innovations, providing even more precise guidance for next-generation sliding motors.
As automation and robotics expand in scope and complexity, the reliance on meticulously calibrated gear systems grows. The power gear slide motor chart empowers professionals across sectors to navigate these complexities, ensuring machines operate at their optimal potential.
Deep Dive into Gear Ratios and Performance Optimization
Having established the foundational role of the power gear slide motor chart, we can now explore how different gear ratios impact performance and specific applications in greater depth.
Gear Ratios and Their Impact on Mechanical Advantage
Gear ratios essentially determine the mechanical advantage conveyed to the load. Higher gear ratios mean more torque but less speed, ideal for tasks that demand power over speed—lifting heavy loads, pressing, or breaking through tough materials.
Conversely, lower gear ratios favor higher speeds at the expense of torque, suited for applications requiring rapid movements or positioning, such as conveyor belts or robotic arms performing delicate tasks.
Imagine the gear chart as a spectrum:
Low Gear Ratios (1:1 to 5:1): For high-speed applications. These configurations provide minimal torque multiplication, allowing faster operation.
Medium Gear Ratios (5:1 to 20:1): Balanced options, perfect for general-purpose machinery where moderate torque and speed are needed.
High Gear Ratios (20:1 and above): Heavy-duty applications demanding maximum torque, albeit at reduced speeds.
Efficiency Considerations
Efficiency is often overshadowed by torque and speed in basic discussions, but it plays an equally vital role in long-term operation and energy consumption. Gear systems inherently lose some energy due to friction and backlash. The gear chart typically displays efficiency ranges (sometimes between 80% to 95%), guiding users toward configurations that align with operational demands.
For example, a high gear ratio may provide the torque needed for lifting but could introduce more friction losses, leading to heat buildup and wear over time. An optimal balance—achieved by consulting the efficiency metrics in the chart—is critical for maintaining system longevity.
Gear Material and Manufacturing Tolerances
While the chart primarily focuses on gear ratios and their output, the real-world performance is influenced by gear material choices and manufacturing tolerances. Modern gear systems use hardened steel, composites, or even advanced ceramics to improve durability and reduce friction.
Manufacturing tolerances determine how precisely gears mesh. Fine-tuned gear teeth improve efficiency and reduce backlash but may increase cost. When interpreting the gear chart, it's useful to consider these factors and select configurations that match your machinery’s real-world construction quality.
Dynamic Load Factors and System Response
The gear chart excels as a static performance guide, but real machines experience dynamic loads, shocks, and variable stresses. Integrating the gear chart data with an understanding of load dynamics enhances predictive maintenance and operational stability.
For instance, gear ratios that provide high torque at low speeds are advantageous for starting loads or overcoming resistance. Conversely, the same gear setup might not be suitable for continuous high-speed operations, where heat accumulation or vibration could become issues.
Control Systems and Electronic Integration
Modern sliding motor systems often include electronic controls—servomotors, variable frequency drives, and feedback sensors—that complement the mechanical gear setup. The gear chart remains a vital reference point, but system engineers now integrate data from the chart with digital controls to optimize performance dynamically.
This synergy enables features like precise positioning, speed regulation, and adaptive load management. Understanding how gear ratios interact with control algorithms can unlock new levels of efficiency and responsiveness.
Case Studies: Real-World Applications
Heavy Machinery Lifting: An industrial crane uses a high gear ratio system (around 30:1), delivering enormous torque to lift construction materials. The gear chart guides the selection of gear sets that withstand substantial loads without excessive wear.
Robotics: A robotic arm performing intricate assembly tasks operates at low gear ratios (about 3:1 or 5:1), enabling rapid, precise movements. The gear chart helps balance speed and torque to match delicate manipulations.
Automated Conveyor Systems: These systems often have variable gear ratios tailored for different operational stages. Using the gear chart, engineers can optimize for power during startup and speed during steady operation.
Designing with the Gear Chart in Mind
For designers, the gear chart is a starting point—providing baseline data that can be refined with software simulations and empirical testing. When selecting gears, considerations such as space constraints, weight, noise levels, and maintenance requirements also play roles.
In addition, safety margins are built into most designs, selecting gear configurations that handle peak loads comfortably. The chart's data, combined with real-world testing, informs these safety factors.
Future Outlook: Smarter, More Efficient Gears
The landscape of gear design is undergoing revolution through innovations like additive manufacturing, which enables complex gear geometries tailored for maximum efficiency, and advanced lubricants that reduce friction. These advancements are likely to be reflected in the future iterations of the gear charts—more detailed, predictive, and user-friendly.
As machines become smarter, integrating sensors and AI-driven data analysis, the role of gear charts will shift from static references to dynamic tools. Real-time performance data could inform adjustments in gear selection or operation parameters, pushing the boundaries of what sliding motors can achieve.
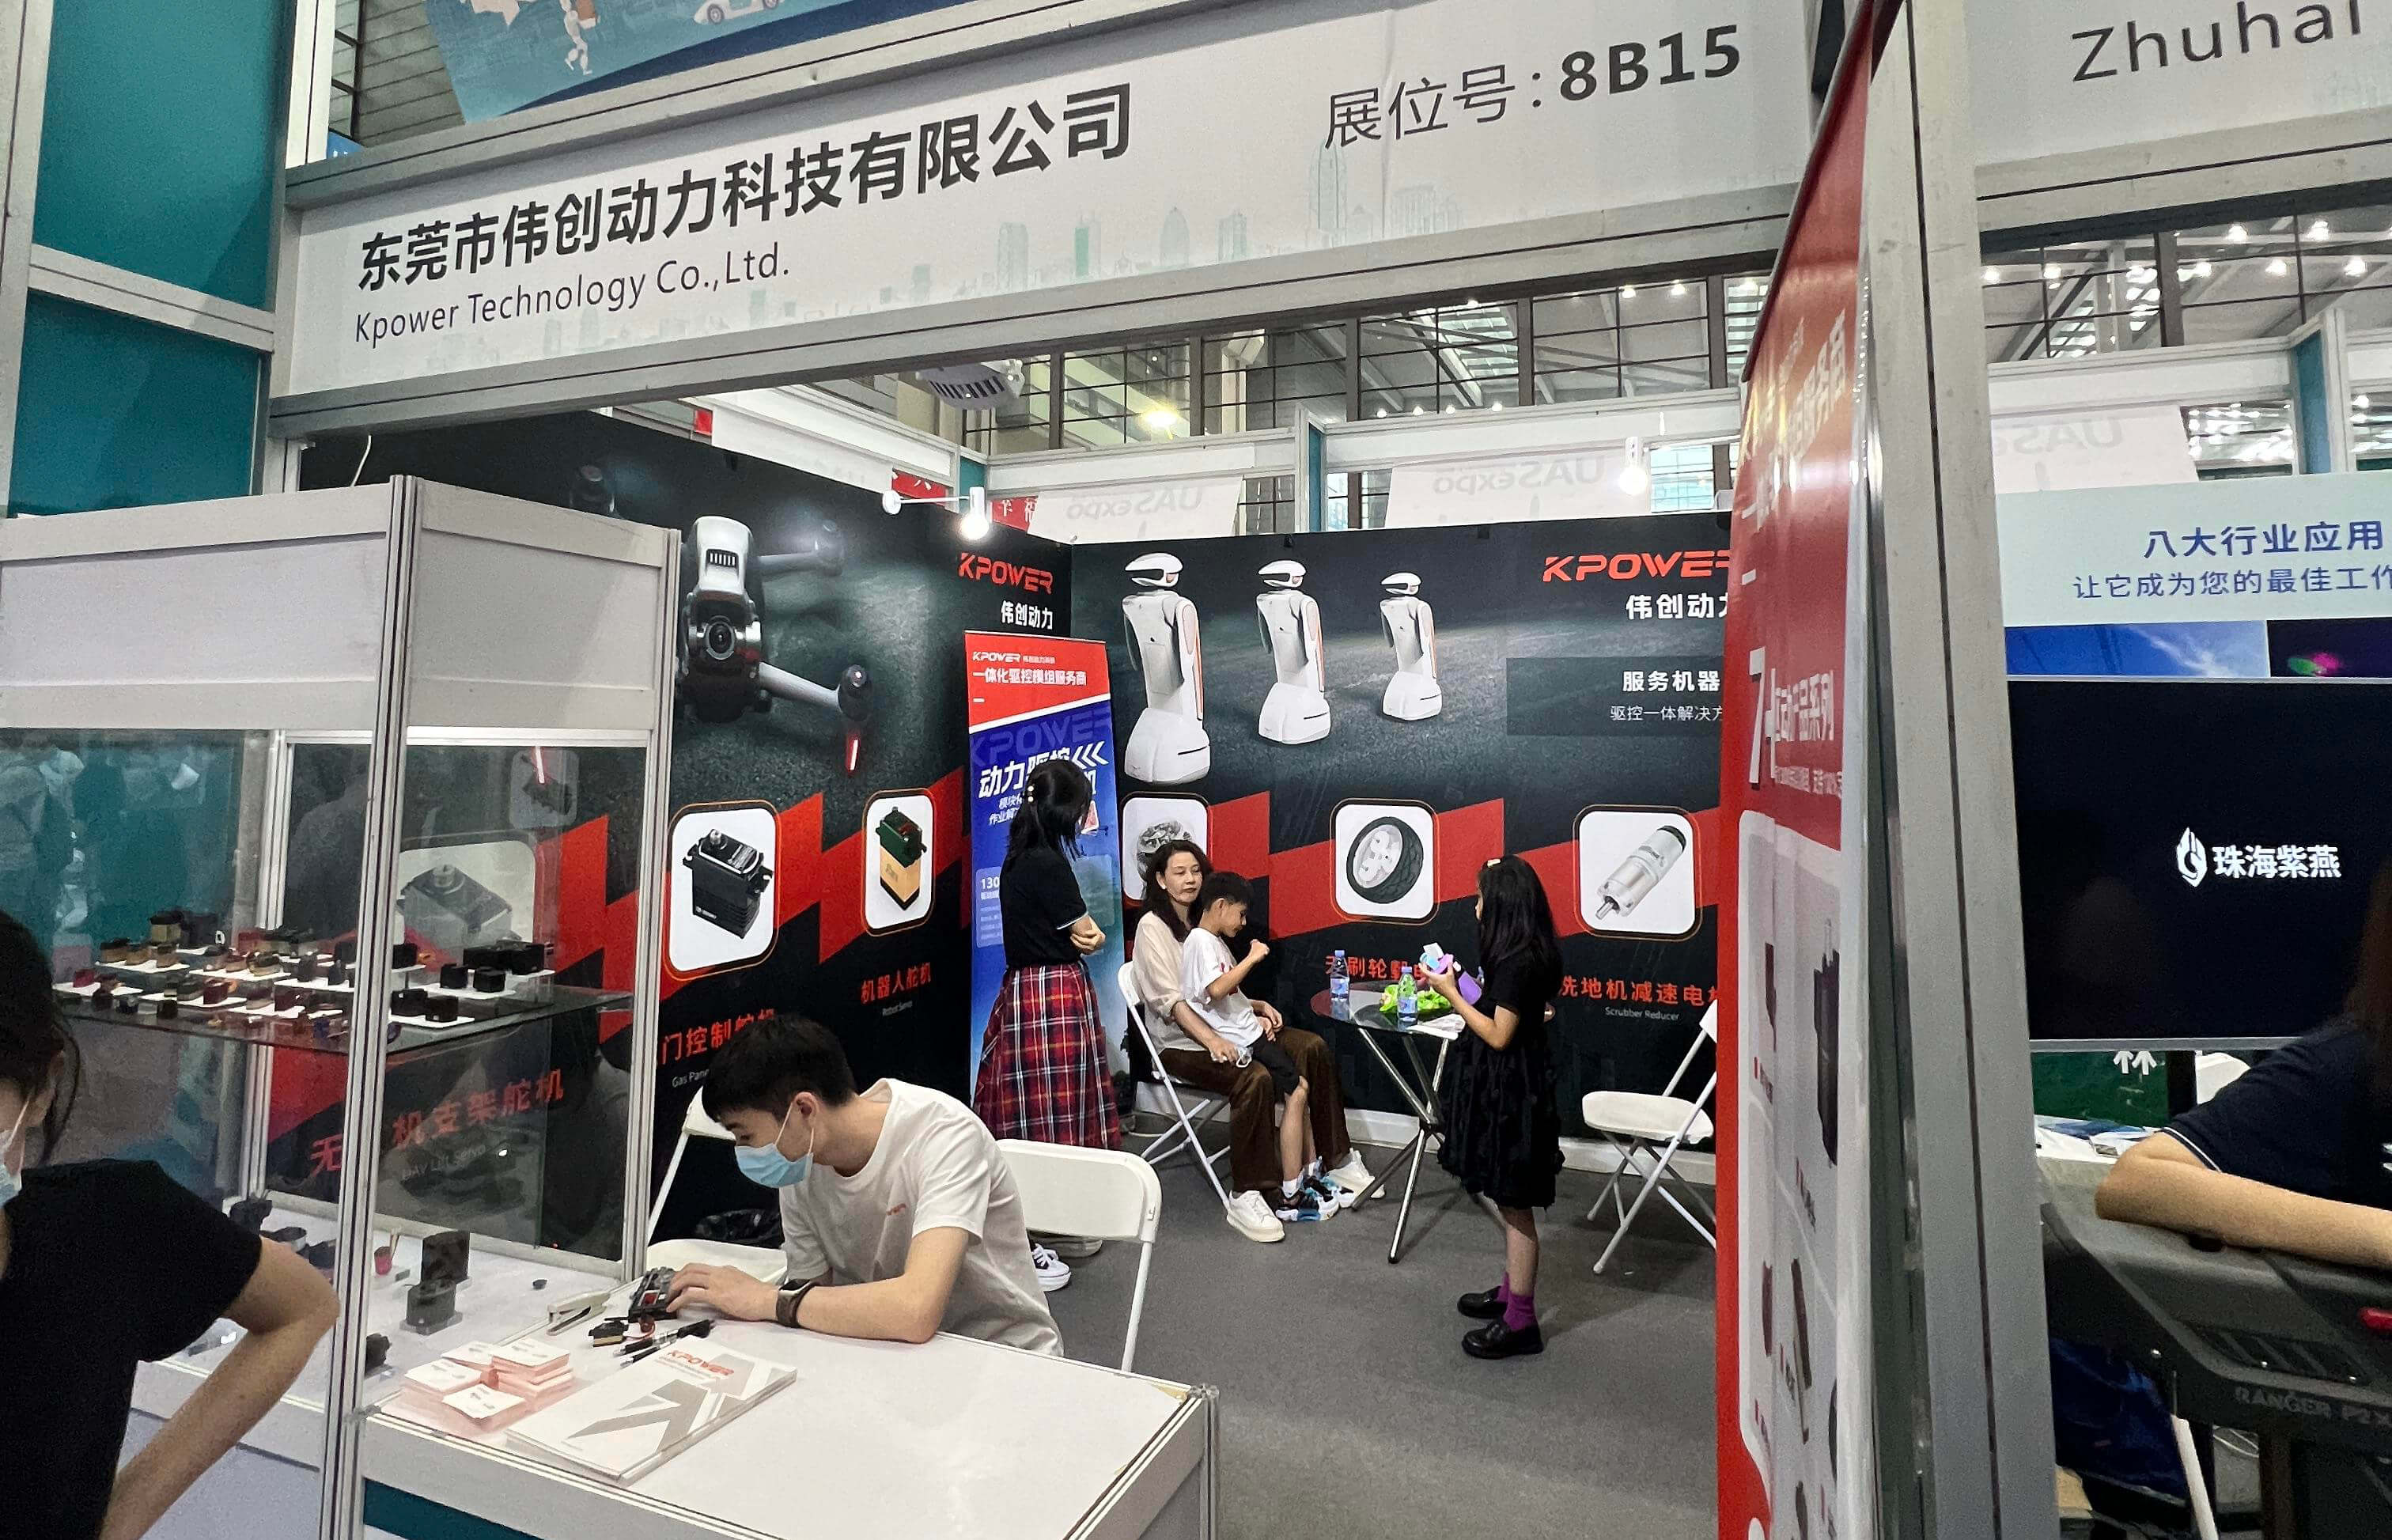
Kpower has delivered professional drive system solutions to over 500 enterprise clients globally with products covering various fields such as Smart Home Systems, Automatic Electronics, Robotics, Precision Agriculture, Drones, and Industrial Automation.
Update:2025-10-15
Contact Kpower's product specialist to recommend suitable motor or gearbox for your product.