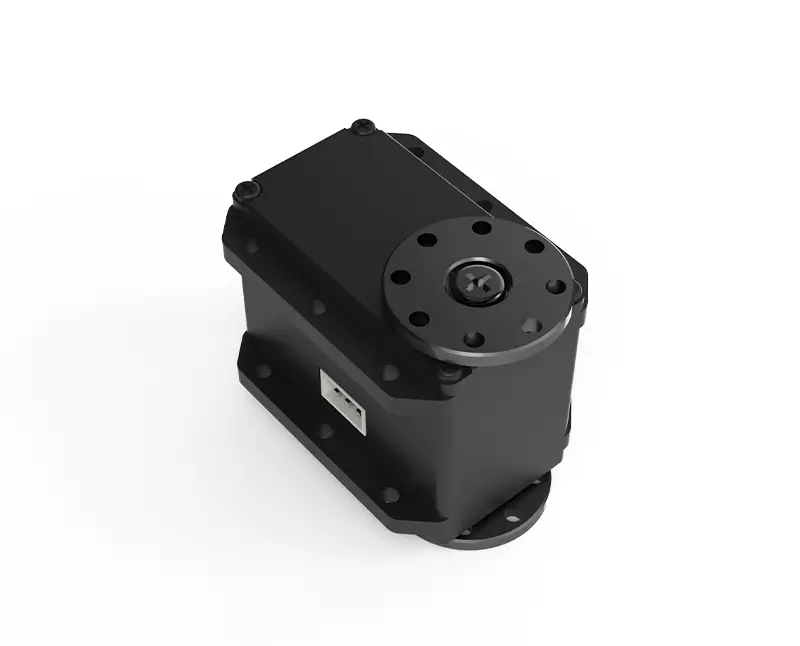
The Science Behind RC Servo Spline Charts
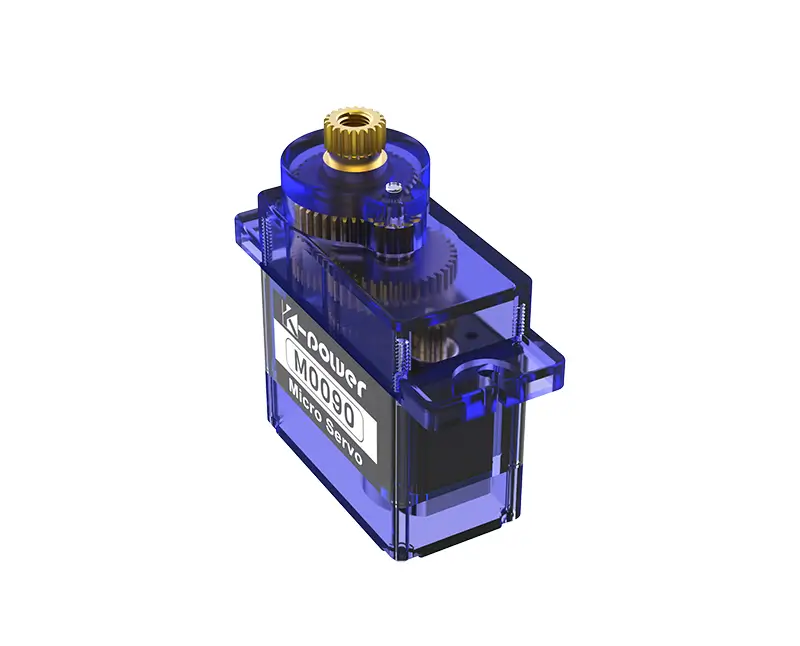
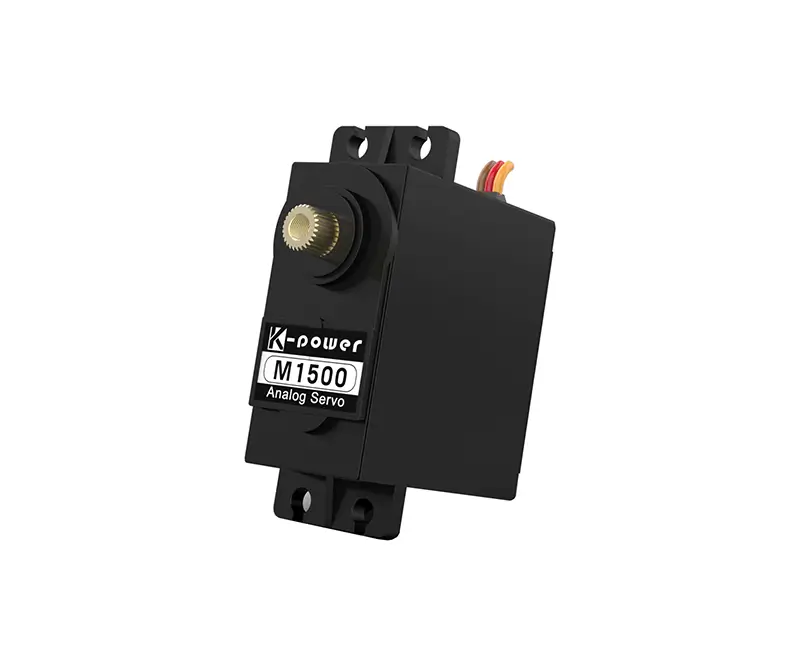
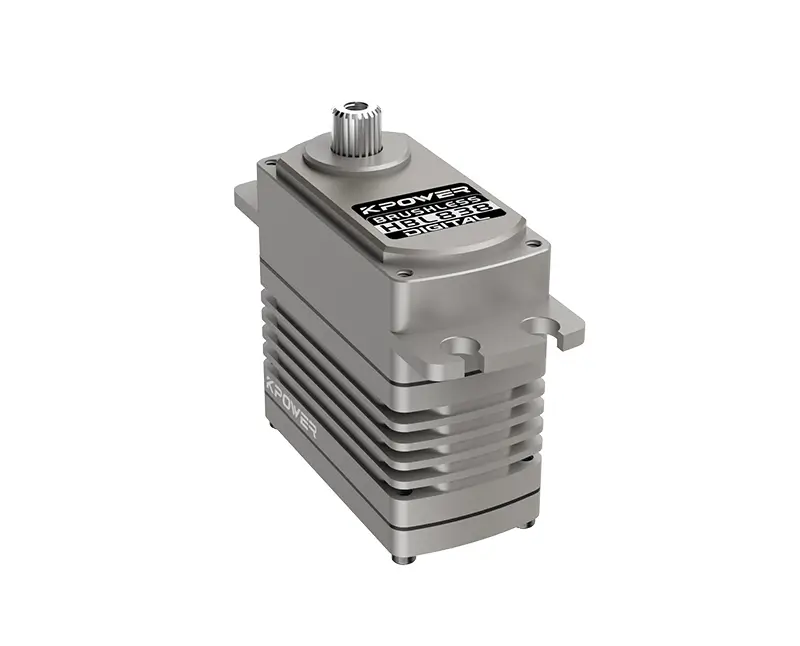
Introduction to RC Servos: The Heart of Precision Motion Remote Control (RC) servos are the unsung heroes of motion control in robotics, drones, and hobbyist projects. These compact devices convert electrical signals into precise mechanical movement, enabling everything from robotic arm articulation to drone wing adjustments. But what separates a good servo from a great one? The answer lies in understanding its performance metrics—and that’s where spline charts come into play.
.webp)
What Is a Spline Chart? A spline chart is a graphical representation of an RC servo’s performance characteristics, plotting critical parameters like torque, rotation angle, and speed against time or input signals. Unlike linear graphs, spline charts use curved lines (splines) to interpolate data points, mimicking the smooth, real-world motion of servos. These charts reveal how a servo responds to Pulse Width Modulation (PWM) signals, which dictate its position and speed.
Why Spline Charts Matter Imagine driving a car: Linear acceleration feels robotic, while smooth acceleration feels natural. Similarly, spline charts show how a servo transitions between positions. A well-designed spline curve ensures seamless motion, reduces mechanical stress, and improves energy efficiency. For applications like aerial drones or robotic surgeries, these nuances make the difference between success and failure.
Key Components of an RC Servo Spline Chart
Torque Curve: Shows the servo’s rotational force at different angles. Rotation Angle vs. PWM Signal: Maps input signals (e.g., 1000–2000µs) to angular output (e.g., 0–180°). Speed Profile: Illustrates how quickly the servo reaches target positions. Hysteresis Loop: Highlights lag between input commands and physical movement.
Decoding the Torque-Rotation Relationship Torque (measured in kg·cm or oz·in) determines a servo’s ability to handle loads. In spline charts, the torque curve peaks at specific angles, indicating where the servo exerts maximum force. For instance, a robotic arm lifting a weight might show higher torque at mid-angles. If the curve dips unexpectedly, it could signal gear slippage or motor inefficiency.
PWM Signals and Angular Precision RC servos rely on PWM signals to set their position. A 1500µs pulse typically centers the servo, while 1000µs and 2000µs drive it to extremes. However, spline charts often reveal non-linearities—especially in low-cost servos—where the actual angle deviates from the “ideal” linear response. Advanced users leverage these charts to calibrate servos or program motion controllers that compensate for irregularities.
Case Study: Drone Gimbal Stabilization Consider a drone camera gimbal: To keep footage steady, the servo must adjust smoothly to wind gusts. A spline chart helps engineers identify jerky transitions in the rotation profile. By tweaking the PWM input curve or selecting a servo with a flatter torque curve, they achieve buttery-smooth stabilization.
Common Pitfalls in Spline Interpretation
Overlooking Hysteresis: Lag between command and movement can cause oscillations in feedback systems. Ignoring Temperature Effects: Servo performance degrades under heat, altering spline curves. Misjudging Load Impacts: Charts measured under no-load conditions won’t reflect real-world behavior.
Optimizing Performance with Spline Chart Insights
Advanced Spline Analysis: From Data to Action Once you’ve mastered spline chart basics, it’s time to harness their full potential. Whether you’re tuning an RC car’s steering or prototyping a humanoid robot, these charts provide actionable insights.
Customizing Motion Profiles Spline charts empower users to design custom motion trajectories. For example, a robotic waiter arm should move swiftly between tables but slow down near glasses to prevent spills. By analyzing speed profiles, you can program acceleration ramps that match the servo’s natural spline curves, ensuring fluid motion without overtaxing the motor.
Troubleshooting with Spline Charts Unexpected dips or spikes in torque curves often indicate mechanical issues. A sudden torque drop at 90° might suggest a damaged gear tooth, while erratic hysteresis loops could point to loose wiring. Comparing charts before and after repairs provides quantifiable proof of fixes.
The Role of Software in Spline Optimization Modern servo controllers like Arduino libraries or ROS (Robot Operating System) packages let users import spline data to automate calibrations. Tools like ServoPlot or RoboAnalyzer simulate how parameter changes affect performance, saving hours of trial-and-error.
Real-World Applications
Robotics: Industrial robots use spline charts to minimize jerk during assembly tasks. RC Racing: Enthusiasts tweak servo curves to balance steering responsiveness and stability. Aerospace: Satellite antenna servos rely on spline-optimized movements to maintain signal alignment.
Future Trends: AI and Spline Charts Machine learning is revolutionizing motion control. AI algorithms can analyze thousands of spline charts to predict servo failures or optimize trajectories in real time. Imagine a drone that adjusts its servo spline mid-flight to compensate for battery drain or payload shifts!
DIY Guide: Generating Your Own Spline Charts
Tools Needed: Servo tester, torque gauge, data logging software (e.g., Plotly or MATLAB). Step 1: Record the servo’s angle at different PWM inputs. Step 2: Measure torque using a lever arm and scale. Step 3: Plot the data with spline interpolation and analyze deviations.
Conclusion: Precision as an Art and Science RC servo spline charts bridge the gap between theoretical specs and real-world performance. By mastering these charts, engineers and hobbyists unlock new levels of precision, transforming clunky machines into elegant systems. As IoT and AI integrate deeper into motion control, spline charts will remain indispensable—a testament to the beauty of blending data with mechanics.
This structured guide equips readers with both foundational knowledge and advanced techniques, positioning spline charts as essential tools for innovation in motion control.


.webp)
