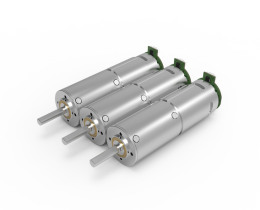
Imagine gazing into the heart of a modern robot, an assembly line, or even a high-tech drone—what do you see? It’s a complex dance of countless components working seamlessly together. At the core of many of these systems lies the humble yet mighty servo motor, a device that embodies precision, speed, and versatility. But how do engineers orchestrate such precise movements? The answer often lies in the elegant language of control diagrams.

A servo motor control diagram isn’t just a drawing; it’s a blueprint of intent, a visual language translating commands into exact physical movements. These diagrams serve as the backbone for designing, troubleshooting, and optimizing systems that demand high accuracy. Whether it’s a robotics arm assembling tiny microchips or a camera lens adjusting focus, understanding how these diagrams work unlocks a new level of mastery over automation.
To grasp the significance of a servo motor control diagram, first, imagine the basic elements: power supply, sensors, controllers, and the servo motor itself. All of these components connect through a web of electronic signals, feedback loops, and operational protocols. The diagram simplifies this complex interplay into a clear map, showing how signals flow and how the motor responds at each step.
At its core, a typical servo control system comprises three primary parts: The Input Signal, the Controller, and the Actuator (the servo motor). The input signal—often a PWM pulse or analog voltage—represents the desired position or speed. This signal is fed into a control device such as a microcontroller or a dedicated servo controller, which processes the information and generates control commands.
Let’s break down the process step-by-step:
Input Signal: This could be from a remote control, sensor, or autonomous system. It dictates the target position or velocity for the servo motor.
Controller: Embedded electronics compare the current position of the motor (feedback) with the desired position. If there's a mismatch, adjustments are generated to correct the action.
Servo Motor: The motor receives these control signals, adjusts its shaft position accordingly, and provides real-time feedback to the controller via sensors like encoders or potentiometers.
What makes a servo control diagram so invaluable is its visualization of these steps. It maps components—motors, controllers, sensors—and their interactions with symbols and annotations. This visual clarity simplifies design and troubleshooting, especially when systems grow more complex with multiple axes or integrated sensors.
In many diagrams, you’ll see how they depict feedback. Feedback loops are vital—they’re what allow the system to self-correct. In traditional control theory, this is called a closed-loop system. The feedback signal, often from an encoder attached to the servo motor, informs the controller whether the target position is achieved. If not, the controller adjusts the control signals accordingly. Think of it as a well-orchestrated conversation where every sentence (control command) is adjusted based on the listener’s (feedback sensor’s) response.
But there’s more to these diagrams than just the flow of signals. They also illustrate the power components: transistors, motor drivers, and power supplies that energize the motor. These elements ensure the movement is not only precise but also physically feasible, handling the torque and speed demands of the task.
As systems advance, control diagrams evolve, incorporating more sophisticated elements such as PID controllers—which fine-tune the response to minimize overshoot and oscillations—or modern digital control algorithms. Each component adds layers of complexity, but the diagram remains a vital tool for both design and diagnosis.
The power of understanding these diagrams shines when you encounter issues or seek to improve system performance. By visually tracing the control signals, engineers can quickly pinpoint malfunctions—be it a sensor misalignment, power supply fault, or software bug. It’s like having a roadmap to the system’s soul.
Yet, for all their technical depth, good control diagrams are also crafted to be accessible and intuitive. They serve as a universal language, bridging the gap between electrical engineers, programmers, and mechanical designers. Through symbols, standardized notation, and logical layout, they make complex systems understandable at a glance.
Looking ahead, the future of servo control diagrams is intertwined with automation trends—smart systems, IoT integration, and AI-powered feedback. Imagine a control diagram that not only maps current signals but predicts potential faults or suggests performance optimizations. As the lines between hardware and software blur, these diagrams will become even more dynamic, interactive tools for engineers.
In summary, whether you're building a robotic arm, designing a drone’s flight system, or exploring automation in manufacturing, mastering the servo motor control diagram is a vital step. It’s the visual language that translates abstract commands into tangible, precise motion—a testament to human ingenuity in controlling the physical world with elegant electronic choreography.
Stepping beyond the basic understanding, it’s fascinating to see how servo motor control diagrams evolve in complexity and sophistication. For those venturing into advanced automation, mastering these diagrams opens doors to cutting-edge innovations. Here, we’ll explore more intricacies, practical applications, and tips for reading and creating these vital schematics.
Understanding the Layers of a Servo Control Diagram
At a glance, a control diagram may appear as a tangled web of symbols, but each layer serves a purpose. Concurrently, these layers integrate mechanical, electrical, and software systems:
Power Layer: Shows how electricity energizes the servo system, including batteries, power supplies, and motor drivers. Understanding this foundation is crucial, since insufficient power or poor wiring can cause erratic behavior or damage.
Control Layer: Embodies the logic—PID controllers, microcontrollers, or FPGA units—interpreting input signals and determining control actions. Advanced diagrams may specify digital communication protocols like CAN bus, I2C, or UART, essential for integrating multiple components.
Feedback Loop: As mentioned earlier, this is the heartbeat of the system. Encoders or resolvers provide high-fidelity position or velocity data. The diagram illustrates how signals traverse back from sensors to controllers, forming a closed loop.
Output Layer: Includes the motor driver or amplifier circuits, which translate control signals into physical movement by energizing the motor windings. Precise schematics show how transistors, bridges, and protective elements (fuses, TVS diodes) interface with the motor.
User Interface & Communication: In more complex setups, diagrams highlight interfaces like LCD panels, Bluetooth modules, or remote controls that enable real-time user commands or system monitoring.
Readability and Standard Symbols
Clarity in diagrams hinges on consistent symbols. Common icons include:
Triangles or arrows for signal flow. Rectangles for control units or microcontrollers. Circles or ovals for sensors or feedback devices. Zigzag lines indicating motor windings or electrical connections. Blocks with labels specifying functions, resistance, capacitance, or other components.
Such consistency helps readers quickly interpret the control logic and identify components’ roles.
Designing a Servo Control Diagram
Creating an effective diagram requires a balance of detail and clarity:
Define system requirements: Speed, torque, precision, environmental constraints.
Select appropriate components: Microcontrollers, sensors, power supplies that match the requirements.
Map signal pathways: Clearly indicate input commands, feedback signals, and actuation control.
Incorporate safety and redundancy features: Overvoltage protection, heat sensors, backup power sources.
Use standardized symbols and annotations: To enhance clarity across interdisciplinary teams.
Practical Cases and Examples
Imagine designing a robotic gripper that uses a servo motor for precise grip control. Your diagram must show:
The input commands from a microcontroller. The PWM signals driving the motor driver. The encoder sensing grip position. Feedback loop adjusting grip strength dynamically.
Similarly, in drone stabilization, control diagrams display how gyroscopes, accelerometers, and flight controllers synchronize to keep the craft balanced, with servo motors adjusting rotor angles.
Troubleshooting and Optimization
Control diagrams are not only planning tools but also diagnostic blueprints. When a system malfunctions:
Cross-reference the diagram to identify where signals may be blocked or degraded. Check whether feedback signals are accurate and timely. Verify power supply integrity to the motor driver. Inspect the control algorithms set within the controller.
Optimization involves tweaking signal parameters—like PWM frequency or PID coefficients—guided by insights from the diagram.
Integration with Modern Technologies
Today, control diagrams increasingly incorporate digital protocols, IoT sensors, and cloud interfaces. Imagine a servo system that logs performance data to a cloud platform, providing real-time diagnostics and predictive maintenance alerts. Such diagrams include communication interfaces, network protocols, and data analytics modules.
Furthermore, simulation tools now allow engineers to model the entire control system virtually, verifying the diagram’s accuracy before physical prototyping. These virtual diagrams help forecast system behaviors, identify bottlenecks, and refine control strategies.
Educational and Industry Application
For students and newcomers, mastering these diagrams aids in understanding how theory translates into practice. Industry professionals use them for documentation, compliance, and continuous improvement. IoT-enabled control diagrams also serve as documentation for remote troubleshooting or upgrades.
Final Thoughts: Bridging Art and Science
Control diagrams for servo motors exemplify a blend of artistic clarity and scientific precision. The visual language condenses complex interactions into digestible visuals, fostering collaboration between electrical engineers, software developers, and mechanical designers. As automation becomes more prevalent, these diagrams evolve, becoming richer and more interconnected, guiding the future of intelligent systems.
In the end, the mastery of servo control diagrams isn’t just about understanding circuitry or software—they’re about shaping the future of technology with every line and symbol. They’re the silent storytellers describing how diverse components collaborate to achieve seemingly impossible feats—making machines move with grace, accuracy, and purpose.
If you'd like, I can expand further or tailor specific sections!
Kpower has delivered professional drive system solutions to over 500 enterprise clients globally with products covering various fields such as Smart Home Systems, Automatic Electronics, Robotics, Precision Agriculture, Drones, and Industrial Automation.


